M&A Reporting & Metrics
Effective M&A reporting and metrics provide visibility into pipeline health, deal performance, and value creation—enabling data-driven decisions, stakeholder confidence, and continuous improvement.

Why M&A Metrics Matter
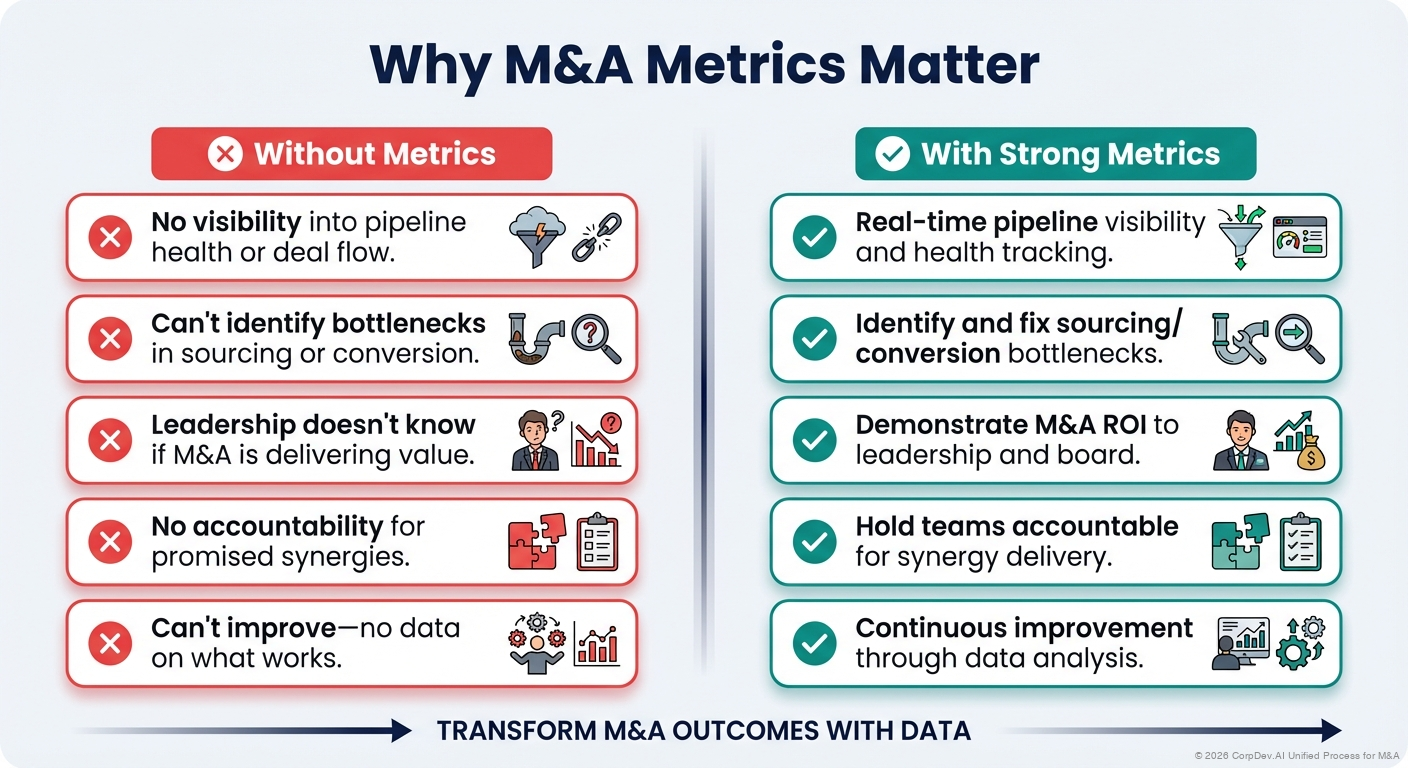
Without Metrics:
- ❌ No visibility into pipeline health or deal flow
- ❌ Can't identify bottlenecks in sourcing or conversion
- ❌ Leadership doesn't know if M&A is delivering value
- ❌ No accountability for promised synergies
- ❌ Can't improve—no data on what works
With Strong Metrics:
- ✅ Real-time pipeline visibility and health tracking
- ✅ Identify and fix sourcing/conversion bottlenecks
- ✅ Demonstrate M&A ROI to leadership and board
- ✅ Hold teams accountable for synergy delivery
- ✅ Continuous improvement through data analysis
The M&A Metrics Framework
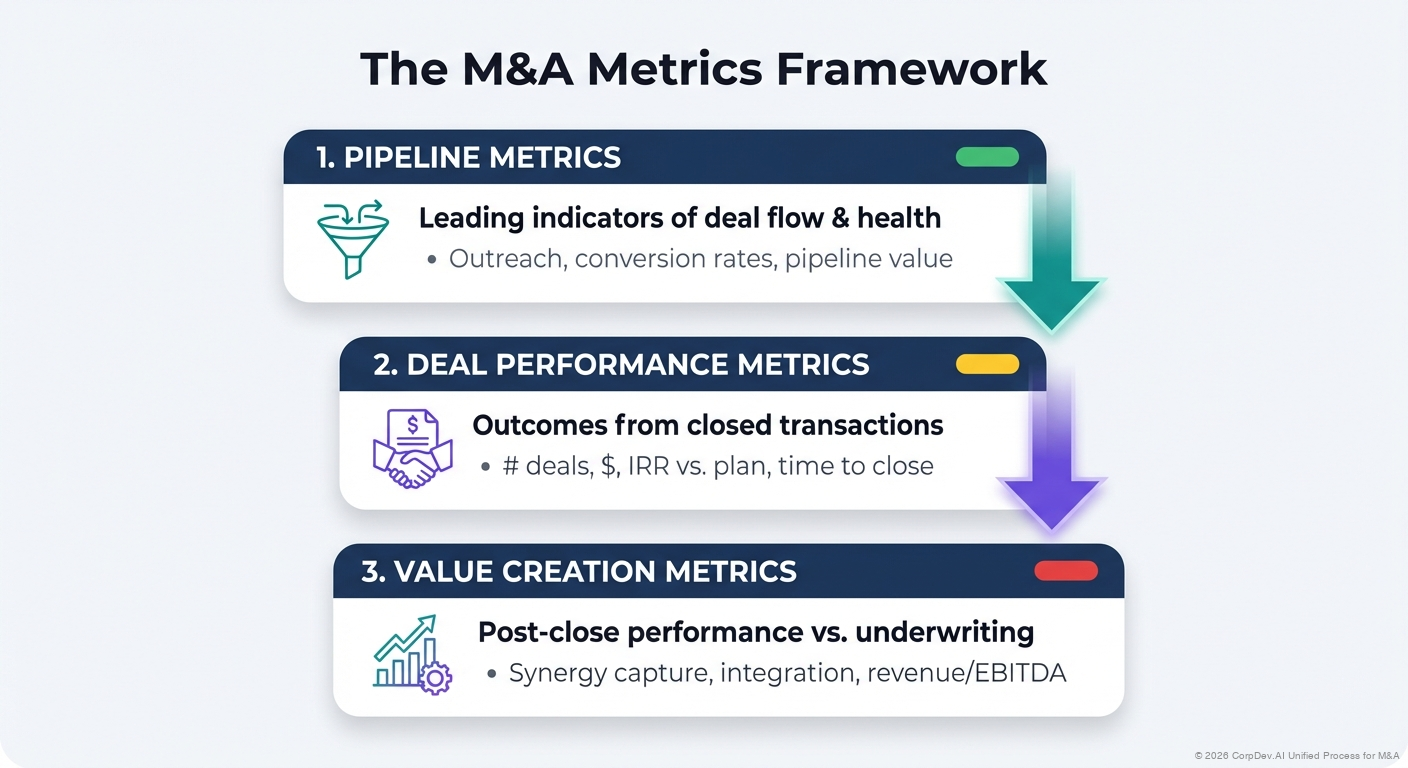
Three Metric Categories
┌────────────────────────────────────────────────────┐
│          1. PIPELINE METRICS                        │
│     Leading indicators of deal flow & health        │
│  (Outreach, conversion rates, pipeline value)      │
└────────────────────────────────────────────────────┘
                       ↓
┌────────────────────────────────────────────────────┐
│          2. DEAL PERFORMANCE METRICS                │
│       Outcomes from closed transactions             │
│    (# deals, $, IRR vs. plan, time to close)       │
└────────────────────────────────────────────────────┘
                       ↓
┌────────────────────────────────────────────────────┐
│       3. VALUE CREATION METRICS                     │
│    Post-close performance vs. underwriting         │
│  (Synergy capture, integration, revenue/EBITDA)    │
└────────────────────────────────────────────────────┘
1. Pipeline Metrics (Leading Indicators)
Core Pipeline KPIs
| Metric | Definition | Target | Frequency |
|---|---|---|---|
| Active Pipeline Count | # of deals in active stages | 10-20 | Weekly |
| Pipeline Value | Total EV of active opportunities | $500M-$2B | Weekly |
| New Adds | # of new deals entering pipeline | 5-10/month | Weekly |
| Deals Killed | # of deals exited from pipeline | 50-70% of total sourced | Weekly |
| Stage Distribution | % of pipeline by stage | Balanced across stages | Weekly |
| Avg. Time in Stage | Days spent in each stage | <90 days per stage | Monthly |
| Stalled Deals | # with no activity in 30+ days | <20% of pipeline | Weekly |
Pipeline Health Dashboard
PIPELINE SNAPSHOT - Week of [Date]

┌──────────────────────────────────────────────────────┐
│  PIPELINE SUMMARY                                     │
├──────────────────────────────────────────────────────┤
│  Active Deals: 15 ($1.2B total value)                │
│  New This Month: 3                                    │
│  Killed This Month: 2                                 │
│  Avg. Age: 68 days                                    │
│  Stalled (>30 days no activity): 2 (13%)             │
└──────────────────────────────────────────────────────┘

PIPELINE BY STAGE:

Closing          ██ 2 deals  ($200M)  ← Target: Close Q4
Diligence        ███ 3 deals ($450M)  ← Active DD in progress
LOI Negotiation  ██ 2 deals  ($180M)  ← IC approved, finalizing terms
Active Pipeline  ████████ 8 deals ($370M) ← Mutual interest, sharing info

PIPELINE HEALTH SCORE: 🟢 82/100
✓ Good stage distribution
✓ Low stall rate (13%)
⚠️ Avg. time in LOI stage high (45 days vs. 30 target)
Sourcing Activity Metrics
| Metric | Weekly Target | Quarterly Target | Annual Target |
|---|---|---|---|
| Targets Contacted | 10-20 | 120-240 | 500-1,000 |
| Response Rate | 30-40% | 30-40% | 30-40% |
| Meetings Booked | 2-4 | 24-48 | 100-200 |
| Meetings Held | 2-4 | 24-48 | 100-200 |
| New Pipeline Adds | 1-2 | 12-24 | 50-100 |
Conversion Funnel Metrics
| Conversion | Formula | Target | Actual | Status |
|---|---|---|---|---|
| Outreach → Response | Responses / Outreach | 30-40% | 35% | 🟢 |
| Response → Meeting | Meetings / Responses | 50-60% | 45% | 🟡 |
| Meeting → Active | Active Pipeline / Meetings | 20-30% | 25% | 🟢 |
| Active → LOI | LOIs / Active Pipeline | 30-40% | 35% | 🟢 |
| LOI → Close | Closes / LOIs | 50-60% | 55% | 🟢 |
| Outreach → Close | Closes / Outreach | 1-2% | 1.5% | 🟢 |
Funnel Visualization:
1,000 Outreach
     ↓ 35%
   350 Responses
     ↓ 45%
   158 Meetings
     ↓ 25%
    40 Active Pipeline
     ↓ 35%
    14 LOIs Signed
     ↓ 55%
     8 Deals Closed

OVERALL CONVERSION: 0.8% (outreach to close)
2. Deal Performance Metrics (Outcomes)
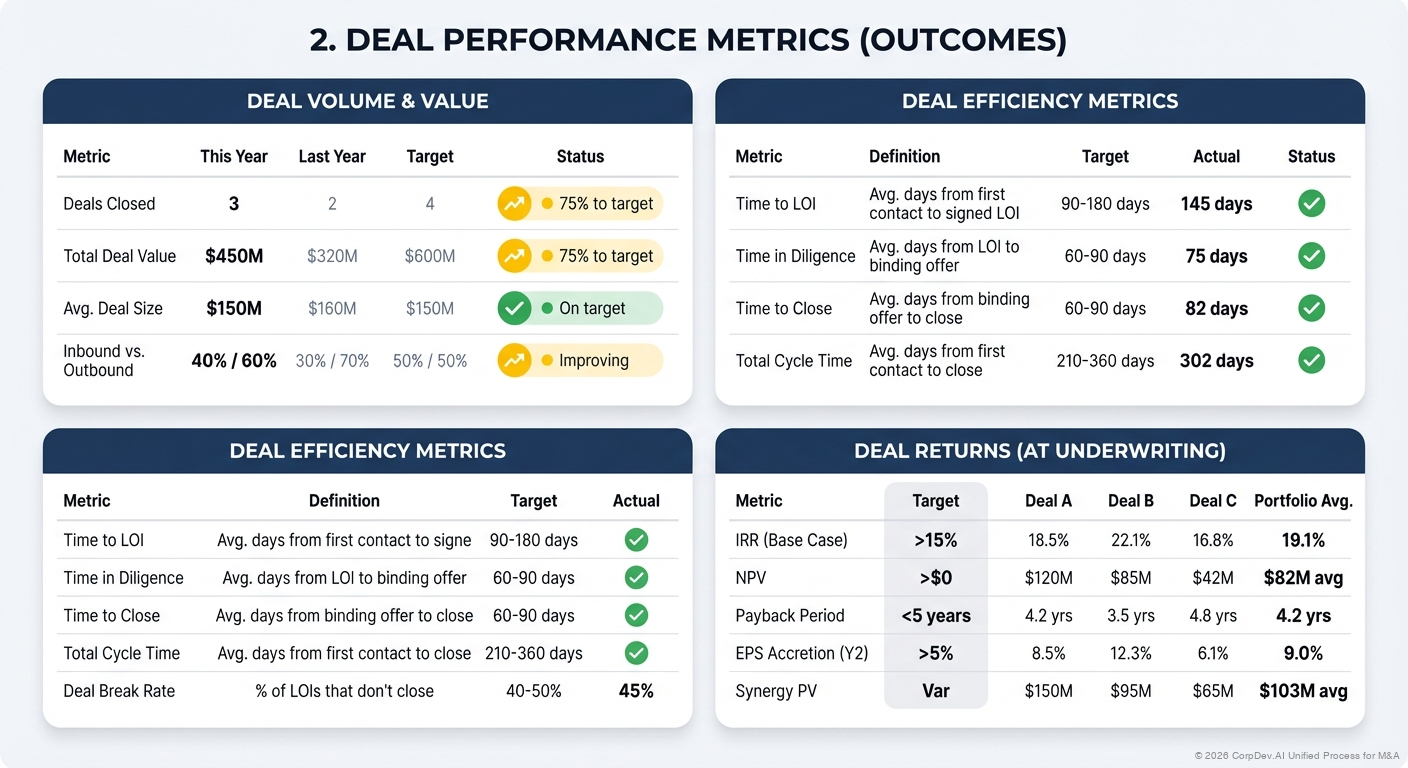
Deal Volume & Value
| Metric | This Year | Last Year | Target | Status |
|---|---|---|---|---|
| Deals Closed | 3 | 2 | 4 | 🟡 75% to target |
| Total Deal Value | $450M | $320M | $600M | 🟡 75% to target |
| Avg. Deal Size | $150M | $160M | $150M | 🟢 On target |
| Inbound vs. Outbound | 40% / 60% | 30% / 70% | 50% / 50% | 🟡 Improving |
Deal Efficiency Metrics
| Metric | Definition | Target | Actual | Status |
|---|---|---|---|---|
| Time to LOI | Avg. days from first contact to signed LOI | 90-180 days | 145 days | 🟢 |
| Time in Diligence | Avg. days from LOI to binding offer | 60-90 days | 75 days | 🟢 |
| Time to Close | Avg. days from binding offer to close | 60-90 days | 82 days | 🟢 |
| Total Cycle Time | Avg. days from first contact to close | 210-360 days | 302 days | 🟢 |
| Deal Break Rate | % of LOIs that don't close | 40-50% | 45% | 🟢 |
Deal Returns (At Underwriting)
| Metric | Target | Deal A | Deal B | Deal C | Portfolio Avg |
|---|---|---|---|---|---|
| IRR (Base Case) | >15% | 18.5% | 22.1% | 16.8% | 19.1% |
| NPV | >$0 | $120M | $85M | $42M | $82M avg |
| Payback Period | <5 years | 4.2 yrs | 3.5 yrs | 4.8 yrs | 4.2 yrs |
| EPS Accretion (Y2) | >5% | 8.5% | 12.3% | 6.1% | 9.0% |
| Synergy PV | Var | $150M | $95M | $65M | $103M avg |
3. Value Creation Metrics (Post-Close)
![]()
Synergy Capture Tracking
Deal Name: CloudSecure Acquisition
| Category | Year 1 Target | Year 1 Actual | % Achieved | Year 3 Run-Rate Target | Status |
|---|---|---|---|---|---|
| Cost Synergies | $11M | $10.2M | 93% | $40M | 🟢 On Track |
| - Headcount | $7M | $6.8M | 97% | $22M | 🟢 |
| - Procurement | $3M | $2.5M | 83% | $10M | 🟡 |
| - IT | $1M | $0.9M | 90% | $3M | 🟢 |
| Revenue Synergies | $3M | $2.1M | 70% | $15M | 🟡 At Risk |
| Total Synergies | $14M | $12.3M | 88% | $55M | 🟢 |
Integration Costs: $22M actual vs. $25M budget (🟢 Under budget)
Integration Scorecard
| Metric | Target | 30 Days | 60 Days | 90 Days | 12 Months |
|---|---|---|---|---|---|
| Milestones On-Time | >85% | 90% 🟢 | 82% 🟡 | 88% 🟢 | 91% 🟢 |
| Employee Retention | >90% | 98% 🟢 | 96% 🟢 | 94% 🟢 | 91% 🟢 |
| Customer Retention | >95% | 99% 🟢 | 98% 🟢 | 97% 🟢 | 96% 🟢 |
| Revenue vs. Plan | 100% | 102% 🟢 | 98% 🟡 | 101% 🟢 | 103% 🟢 |
| EBITDA vs. Plan | 100% | 95% 🟡 | 98% 🟡 | 102% 🟢 | 108% 🟢 |
| Synergy Capture | 100% of plan | 85% 🟡 | 90% 🟢 | 88% 🟢 | 93% 🟢 |
Portfolio Performance (All Deals)
Actual vs. Underwriting (12-24 months post-close)
| Deal | Vintage | IRR Underwrit | IRR Actual | Variance | Synergies Captured | Status |
|---|---|---|---|---|---|---|
| CloudSecure | 2024 | 18.5% | TBD (6mo) | TBD | 88% of Y1 plan | 🟢 On Track |
| DataAnalytics | 2023 | 22.1% | 20.5% | -160bps | 95% of plan | 🟢 Exceeding |
| CyberTech | 2023 | 16.8% | 14.2% | -260bps | 75% of plan | 🟡 Below Plan |
| SaaSCo | 2022 | 19.3% | 21.8% | +250bps | 102% of plan | 🟢 Exceeding |
| AIVendor | 2022 | 17.5% | 15.9% | -160bps | 82% of plan | 🟡 Below Plan |
Portfolio Average: 18.1% actual vs. 18.8% underwriting (-70bps) 🟢 Within Target
Monthly M&A Dashboard (Leadership View)
Dashboard Template
M&A MONTHLY DASHBOARD - [Month Year]

═══════════════════════════════════════════════════════
PIPELINE SUMMARY
═══════════════════════════════════════════════════════
Active Deals: 15 ($1.2B value) | New: 3 | Killed: 2
Pipeline Health: 🟢 82/100
Stalled Deals: 2 (13%)
Avg. Time in Pipeline: 68 days

UPCOMING MILESTONES:
• CloudSecure: IC presentation 11/15
• DataViz: LOI signing target 11/20
• AITech: Diligence complete 11/30

═══════════════════════════════════════════════════════
DEAL ACTIVITY (YTD)
═══════════════════════════════════════════════════════
Closed Deals: 3 ($450M) vs. Target 4 ($600M) → 75% to goal
Avg. IRR (underwriting): 19.1% vs. 15% hurdle → 🟢 Strong
Time to Close: 302 days avg. → 🟢 On target

DEALS CLOSED THIS QUARTER:
• CloudSecure ($200M) - Closed 10/15
• AIStartup ($50M) - Closed 10/28

═══════════════════════════════════════════════════════
POST-CLOSE PERFORMANCE (Last 24 Months)
═══════════════════════════════════════════════════════
Synergy Capture: 88% of plan (across 5 deals)
Integration On-Time: 89% milestones hit
Employee Retention: 92% (vs. 90% target)
Customer Retention: 96% (vs. 95% target)

DEALS REQUIRING ATTENTION:
• CyberTech: Revenue 12% below plan, synergies at 75%
  Action: Monthly reviews with BU, adjusted timeline

═══════════════════════════════════════════════════════
MARKET INTELLIGENCE
═══════════════════════════════════════════════════════
• Competitor X acquired YZ Corp for $300M (8.5x EBITDA)
• SaaS multiples down 15% from peak (now 4.2x ARR median)
• 3 targets in our pipeline raised funding (may delay exits)
Reporting Cadence
Weekly (Internal Team)
Report: Pipeline Snapshot
Audience: Corp Dev team
Format: Email or Slack update (5 bullets)
Contents:
- Pipeline count and value
- New adds and kills
- Stage movements
- Upcoming milestones
- Blockers
Monthly (Leadership)
Report: M&A Dashboard
Audience: CFO, CEO, COO
Format: 1-2 page PDF + 30 min discussion
Contents:
- Pipeline summary
- Deal activity YTD
- Post-close performance
- Market intelligence
- Issues requiring decisions
Quarterly (Board)
Report: Board Update
Audience: Board of Directors
Format: 5-10 slide presentation + 30 min discussion
Contents:
- M&A strategy refresh
- Pipeline overview (high-level, no confidential details)
- Closed deals and performance
- Market trends
- Requests for guidance
→ See Board Reporting for detailed board templates
Key Performance Indicators (KPIs)
Corporate Development Team KPIs
Annual Targets:
- Deals closed: 3-5
- Total deal value: $400M-$800M
- Avg. IRR (underwriting): >15%
- Pipeline health score: >75/100
- Sourcing conversion rate: >1.5% (outreach → close)
- Time to close: <12 months avg.
Individual KPIs (VP/Director):
- Deals closed (as sponsor): 1-2/year
- IC presentations: 3-5/year
- Pipeline adds: 10-15/year
- Synergy delivery (for past deals sponsored): >85% of plan
M&A Program KPIs (Company-Level)
Strategic:
- % of M&A deals aligned with stated priorities: >90%
- Market share gains from M&A: +X% per year
- Capability gaps filled: X of Y strategic priorities
Financial:
- Aggregate IRR (actual, 2-3 years post-close): >12%
- Synergy capture rate: >85% of promised value
- ROIC on M&A capital: >WACC + 500bps
Operational:
- Employee retention (acquired companies): >90% at 12 months
- Customer retention: >95% at 12 months
- Integration milestone completion: >85% on-time
Common Reporting Mistakes
❌ Mistake 1: Reporting Activity, Not Outcomes
Problem: "We had 50 meetings this quarter!"
Solution: Focus on outcomes - deals closed, pipeline value, conversion rates, synergy delivery
❌ Mistake 2: No Post-Close Tracking
Problem: Report deals at close, never mention again
Solution: Track post-close performance for 2-3 years, report actual vs. underwriting
❌ Mistake 3: Overly Detailed Pipeline Reports
Problem: Board gets spreadsheet with 30 confidential target names
Solution: Aggregate pipeline metrics, only name deals at LOI+ stage or with board approval
❌ Mistake 4: No Trend Analysis
Problem: Point-in-time snapshots with no context
Solution: Show trends over time - is pipeline growing? Conversion improving?
❌ Mistake 5: Metrics Without Action
Problem: Report that sourcing conversion is 0.5% (below 1.5% target), but no plan to fix
Solution: Every metric below target needs action plan and owner
Metrics Tech Stack
Spreadsheet-Based (Small Teams)
Tools: Excel, Google Sheets
Pros: Free, flexible, easy to start
Cons: Manual updates, limited automation, no collaboration
Best For: 1-2 person teams, <20 active pipeline
CRM + Analytics (Mid-Sized Teams)
Tools: CorpDev.Ai, DealCloud, Affinity, Salesforce + Tableau/Looker
Pros: Automated tracking, real-time dashboards, collaboration
Cons: $25K-$100K/year (traditional tools), implementation effort
Best For: 3-5 person teams, >20 active pipeline, data-driven culture
Full M&A Platform (Large Teams)
Tools: CorpDev.Ai, DealCloud, Altvia, Datasite Analytics
Pros: End-to-end M&A workflow, pipeline + diligence + integration tracking
Cons: $100K-$250K+/year (traditional platforms), significant implementation
Best For: 6+ person teams, >5 deals/year, enterprise M&A programs
Key Takeaways
- Three metric categories - Pipeline (leading), Deal Performance (outcomes), Value Creation (post-close)
- Track conversion funnel - Outreach → Response → Meeting → Active → LOI → Close
- Pipeline health matters - Monitor count, value, stalled deals, time in stage
- Report outcomes, not activity - Deals closed and value created, not meetings held
- Post-close accountability - Track synergy capture and integration for 2-3 years
- Right frequency - Weekly (team), monthly (leadership), quarterly (board)
- Dashboards over decks - 1-2 page dashboard > 20-slide PowerPoint
- Trends > snapshots - Show performance over time, not just current state
- Metrics drive action - Every metric below target needs owner and improvement plan
"What gets measured gets managed." M&A metrics provide visibility, accountability, and continuous improvement. Companies that rigorously track pipeline, deal performance, and post-close value creation consistently outperform those that don't.
Related Resources
- M&A Operations Overview - Complete operations framework
- Sourcing Cadence - Pipeline development and tracking
- Board Reporting - Board-level M&A reporting
- Corporate Development KPIs & Metrics - Detailed KPI frameworks
- Value Creation Planning - Synergy tracking post-close
© 2026 CorpDev.Ai Unified Process for M&A
Last updated: Thu Oct 30 2025 20:00:00 GMT-0400 (Eastern Daylight Time)